📈 What is Linear Regression?
Linear Regression is a statistical method used to model the relationship between a dependent variable (Y) and one or more independent variables (X).
🔹 In Simple Linear Regression:
You’re modeling the relationship between:
-
One independent variable (X)
-
One dependent variable (Y)
The relationship is expressed using a straight line:
Y = a + bX +
-
Y = Dependent variable
-
X = Independent variable
-
a = Intercept (value of Y when X = 0)
-
b = Slope (change in Y for a one-unit change in X)
-
ε = Error term (captures random variations)
Linear Regression helps us estimate the change in Y for one-unit change of x.
🧮 What is Method of Least Squares it?
The Method of Least Squares is a mathematical technique used to find the best-fitting line (or curve) through a set of data points in regression analysis.
Its goal is to minimize the sum of the squares of the errors (called residuals) between the observed values and the values predicted by the regression line.
📈 Used In:
-
Simple Linear Regression
(One independent variable X, one dependent variable Y) -
Multiple Regression
(Multiple X variables predicting a single )
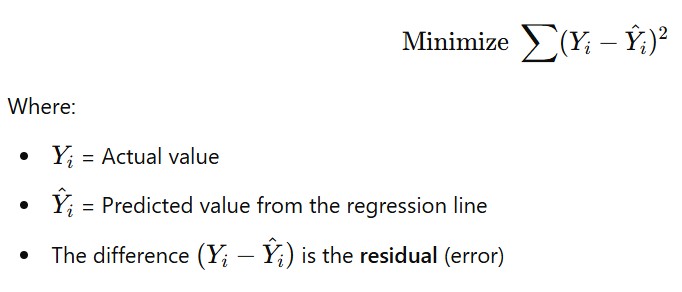
📊 Why is it called “Least Squares”?
Because it minimizes the sum of squared differences between actual and predicted values of the dependent variable:
🔢 Simple Linear Regression Formula:
Y = a + bX
Where:
-
Y = Dependent variable
-
X = Independent variable
-
a = Intercept (value of Y when X = 0)
-
b = Slope (change in Y for each unit change in X)
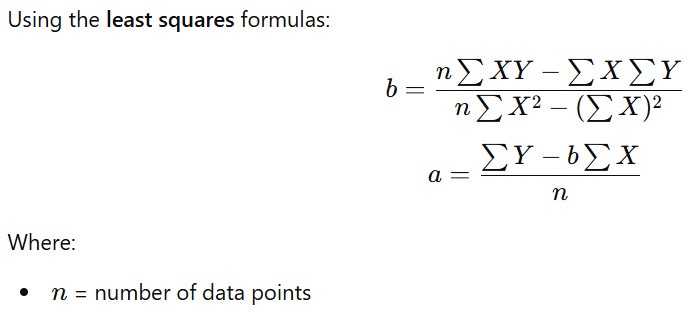
🔍 How are a and b calculated?
Using the least squares formulas:
✅ Steps to Use Least Squares Method:
-
Collect X and data.
-
Calculate ∑X, ∑Y, ∑XY, ∑X2.
-
Compute slope bb and intercept aa.
-
Build regression equation: Y^ = a + bX
-
Use it to predict values or analyze the relationship.
📌 Key Assumptions:
-
Linear relationship between X and Y
-
Homoscedasticity (constant variance of errors)
-
Errors are normally distributed
-
Errors are independent