Part I : The Basic Phillips Curve (Short-Run):
The Phillips Curve was first introduced by A.W. Phillips in 1958.
In the short-run, the Phillips Curve shows an inverse relationship between inflation and unemployment:
-
Low Unemployment → Higher Inflation: When unemployment is low, firms compete for fewer workers, leading to higher wages. As wages rise, companies pass on the higher costs to consumers in the form of higher prices, leading to inflation.
-
High Unemployment → Lower Inflation: When unemployment is high, there is less pressure on wages, which reduces the costs for businesses, leading to lower inflation.
Graphical Representation:
-
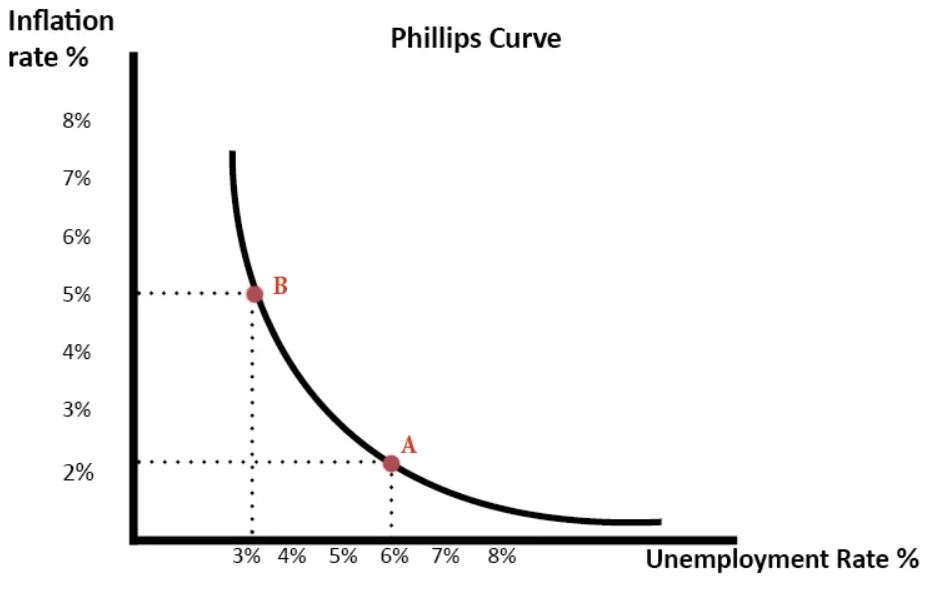
The Phillips Curve is typically shown as a downward-sloping curve, where the x-axis represents the unemployment rate, and the y-axis represents the inflation rate.
-
As you move from left to right (from lower unemployment to higher unemployment), the inflation rate decreases.
Example of the Short-Run Phillips Curve:
Imagine the economy is at a point where unemployment is 6%, and inflation is running at 2%. If unemployment drops to 3%, businesses might increase wages to attract workers. As wages go up, prices of goods and services also rise, causing inflation to rise, say to 5%.
This shows the inverse relationship: lower unemployment leads to higher inflation.
Part II: Stagflation (A Challenge to the Phillips Curve):
-
The 1970s oil crisis presented a challenge to the original Phillips Curve.
-
During this time, many economies experienced stagflation: high inflation and high unemployment at the same time.
-
This contradicted the basic premise of the Phillips Curve, where it was assumed that inflation and unemployment would be inversely related.
-
Stagflation showed that supply-side shocks, like an oil price increase, could lead to both higher inflation and higher unemployment.
Part III: The Long-Run Phillips Curve:
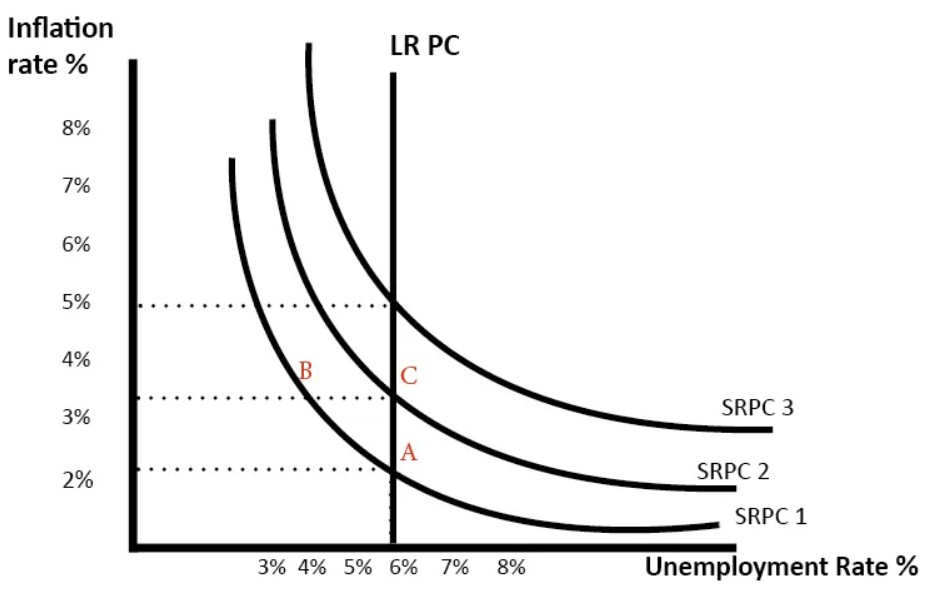
- Friedman’s View: Friedman argued that the short-run trade-off between inflation and unemployment would not persist in the long run.
-
According to Friedman, in the long run, the Phillips Curve is vertical at the natural rate of unemployment (NRU), implying that there is no trade-off between inflation and unemployment in the long run.
-
This is often summarized as:
Long-Run Phillips Curve=Vertical at Natural Rate of Unemployment (NRU) - In the long run, there is no trade-off between inflation and unemployment. This is because, over time, expectations about inflation adjust. If inflation keeps rising, workers will demand higher wages to keep up with the rising cost of living, which can result in inflationary spirals.