The Chi-Square Goodness of Fit Test is a statistical test used to determine if the observed data (collected from a sample) fits an expected distribution. It compares the observed frequencies of events in different categories to the frequencies we would expect to find if the data were consistent with a specific hypothesis (usually the null hypothesis).
The goodness-of-fit test, which asks a theoretical question such as, “How well does the coin in my hand match a theoretically fair coin?”
Assumptions of the Chi-Square Test:
- The data consists of categorical variables (nominal or ordinal data).
- The observations are independent of each other.
- The expected frequency for each category is sufficiently large (usually at least 5).
Key Points:
-
Purpose: To assess whether the distribution of categorical data matches an expected distribution.
-
Null Hypothesis (H₀): The observed data follows the expected distribution (i.e., there is no significant difference between the observed and expected frequencies).
-
Alternative Hypothesis (H₁): The observed data does not follow the expected distribution (i.e., there is a significant difference between the observed and expected frequencies).
Steps to Perform the Test:
-
Determine the categories: Break the data into categories or groups. These categories are typically qualitative (e.g., colors, types of animals, age groups).
-
Compute the expected frequencies:
- The expected frequency for each category is calculated based on the assumption that the null hypothesis is true.
- For example, if you have a sample of 100 people, and you expect 50 to choose red, 30 blue, and 20 green, the expected frequencies would be 50, 30, and 20 respectively.
-
Calculate the Chi-Square Statistic (χ²): The formula for the test statistic is:
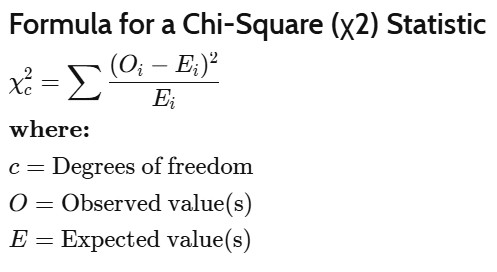
- The sum is over all categories.
-
Determine the degrees of freedom (df): This is given by the formula:
df = k – 1
Where k is the number of categories.
-
Find the critical value or p-value: Use the Chi-Square distribution table or a statistical software to find the critical value corresponding to the chosen significance level (α, usually 0.05) and the degrees of freedom. Alternatively, you can calculate the p-value for the test.
-
Decision:
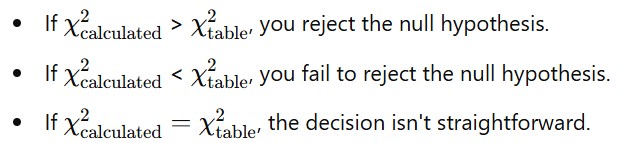
- If the calculated Chi-Square statistic is greater than the critical value (or if the p-value is less than the significance level α), reject the null hypothesis.
- If the calculated Chi-Square statistic is less than the critical value (or if the p-value is greater than α), do not reject the null hypothesis.
- In practice, when the statistic equals the table value, it’s effectively on the boundary, implying no strong evidence against or for the null hypothesis.
Example:
Imagine you are testing if a six-sided die is fair. You roll the die 60 times and get the following results:
| Outcome | Observed Frequency (O) |
|---|---|
| 1 | 8 |
| 2 | 12 |
| 3 | 10 |
| 4 | 11 |
| 5 | 9 |
| 6 | 10 |
Expected frequency (E) for each outcome, assuming the die is fair, would be 60/6=1060 / 6 = 10 for each face.
- Calculate the Chi-Square statistic:
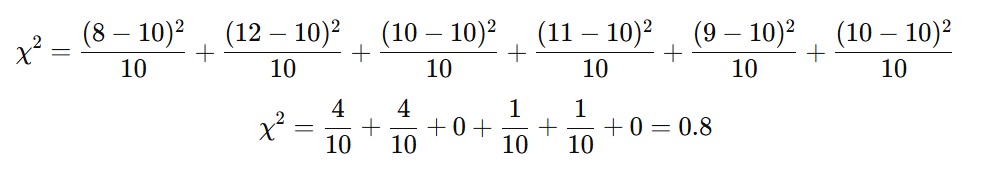
- Degrees of freedom:
df= 6−1 = 5df = 6 – 1 = 5
-
Find the critical value: Using a Chi-Square table, for df = 5 and alpha = 0.05, the critical value is approximately 11.07.
-
Compare the calculated value: Since 0.8 is less than 11.07, we fail to reject the null hypothesis. This suggests that the die is fair, and the observed results do not significantly differ from the expected results.
The Chi-Square Goodness of Fit Test is a versatile tool for analyzing categorical data and is widely used in various fields, such as genetics, market research, and social sciences.