1. What is the Correlation Coefficient?
The correlation coefficient (r) is a statistical measure that quantifies the strength and direction of the linear relationship between two variables, X and Y.
2. Formula for Correlation Coefficient (rr):
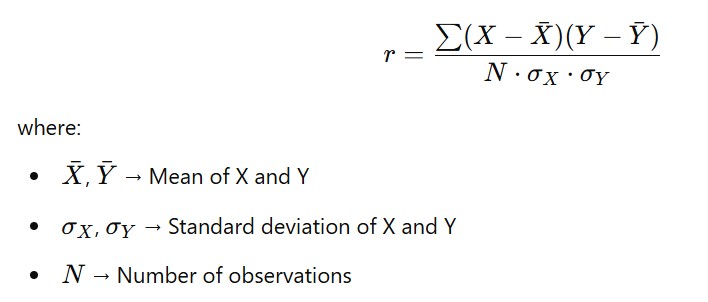
3. Properties of Coefficient of Correlation (r):
-
Range of Values:
-
The value of r lies between -1 and +1
-
−1 ≤ r ≤ +1
-
-
Direction of Relationship:
-
r > 0 → Positive correlation (both variables increase or decrease together)
-
r < 0 → Negative correlation (one variable increases, the other decreases)
-
r = 0 → No correlation (no linear relationship)
-
-
Perfect Correlation:
-
r = +1 → Perfect positive linear relationship
-
r = –1 → Perfect negative linear relationship
-
-
Unit-Free Measure:
-
Correlation coefficient is dimensionless; it has no units.
-
It measures the strength and direction of a relationship, not its scale.
-
-
Symmetry:
-
The correlation between X and Y is the same as between Y and X
-
-
-
Unaffected by Change of Origin and Scale (for linear transformations):
-
Changing the origin (adding/subtracting a constant) or scale (multiplying/dividing by a constant) of variables does not affect r.
-
Example: r will remain the same if X is transformed to 2X + 5.
-
-
Linear Relationship Only:
-
Correlation coefficient only measures linear relationships.
-
Non-linear relationships may exist even if r is close to 0.
-
-
Not Proof of Causation:
-
A high correlation does not imply causation.
-
Example: Ice cream sales and drowning may be correlated (due to summer) but one does not cause the other.
-
2.
3.