The Coefficient of Variation (CV) is a statistical measure of the relative variability of a dataset or a distribution. It is defined as the ratio of the standard deviation to the mean, and it is usually expressed as a percentage.
Mathematically, the Coefficient of Variation (CV) is given by:
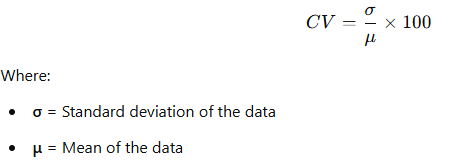
The CV is useful because it allows you to compare the variability of different datasets, even if their means are on different scales or if the datasets are measured in different units.
Interpretation of CV:
-
A higher CV indicates higher relative variability in the data.
-
A lower CV indicates less relative variability in the data.
-
For a data set with a CV of 0, the data has no variability (i.e., all values are the same).
-
In cases where CV is large, it suggests a large degree of variability relative to the mean.
Key Features of the Coefficient of Variation:
The Karl Pearson Coefficient of Variation (CV) helps us understand several key characteristics of a dataset, particularly in terms of relative dispersion and consistency. Here’s what it tells us:
1. Degree of Variation (Relative Dispersion) (Variability)
-
The CV measures the extent of variability in relation to the mean.
-
A higher CV indicates greater variability, meaning the data points are more spread out.
-
A lower CV indicates more consistency, meaning the data points are closely clustered around the mean.
2. Comparability Between Data Sets
-
Since CV is unitless (expressed as a percentage), it allows us to compare datasets with different units or scales.
-
Example: You can compare income variability (in dollars) with height variability (in centimeters) using CV, which isn’t possible with standard deviation alone.
3. Stability & Risk Measurement
-
Lower CV → More stable dataset (less relative variation).
-
Higher CV → More unstable or risky dataset.
-
Used in finance (to compare stock volatility), manufacturing (to assess product consistency), and biological sciences (to measure trait variability).
4. Dependence on the Mean
-
Since CV is calculated as:
CV = (σ/ μ ) ×100
It is sensitive to the mean ():
-
If is very small, CV can be misleadingly high even if absolute variation is low.
-
Not applicable when , as division by zero is undefined.
-
5. Uniformity or Consistency in Data
-
CV < 20% → Data is highly consistent (e.g., precise manufacturing).
-
CV between 20%-50% → Moderate variation.
-
CV > 50% → High variability (data lacks uniformity, possibly unreliable).