The Poisson distribution is a probability distribution that models the number of events that occur within a fixed interval of time or space, given that these events happen with a known constant mean rate and independently of each other. It’s often used in situations where you’re counting the number of occurrences of some event, like:
-
The number of phone calls at a call center in an hour
-
The number of accidents at a traffic intersection during a day
-
The number of emails received per hour
Key Features of the Poisson Distribution:
-
Discreteness: It’s a discrete probability distribution, which means it models counts of events (like 0, 1, 2, 3… events).
-
Constant Rate (λ): The events occur at an average rate of λ (lambda), which is the expected number of events per interval.
-
Independence: The occurrence of an event in one interval does not affect the occurrence of an event in another interval.
-
Rare Events: The events modeled by the Poisson distribution tend to be rare or uncommon, though they can happen at any point in time.
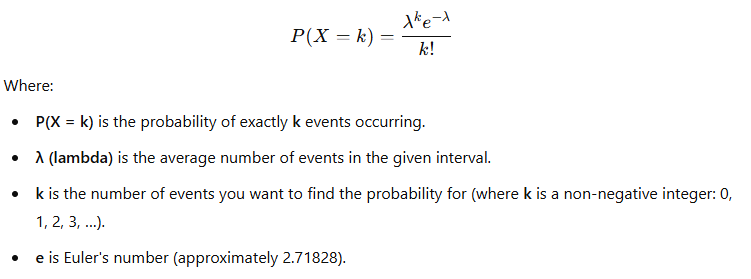
Poisson Distribution Formula:
The probability of observing exactly k events in an interval is given by the formula:
Example:
Suppose a bookstore receives, on average, 3 customers per hour. You want to know the probability of receiving exactly 5 customers in an hour.
Here, λ = 3 (the average number of customers per hour), and we are interested in k = 5 (exactly 5 customers). Using the formula:
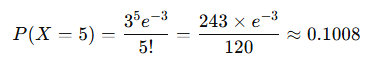
So, the probability of exactly 5 customers coming in the next hour is about 0.1008 (or 10.08%).
When to Use the Poisson Distribution:
-
When the events are independent.
-
When events happen at a constant average rate.
-
When you are counting occurrences over a fixed time period or in a fixed area/volume.
The Poisson distribution is a useful model for many real-world phenomena, particularly in situations involving rare events over time or space.