A relative frequency distribution is a statistical table that shows the proportion (or percentage) of observations within different categories or class intervals. Instead of showing just counts (frequencies), it represents the relative frequency of each category in relation to the total number of observations.
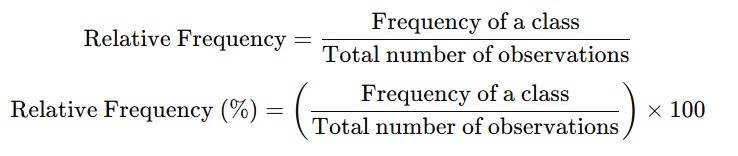
Formula for Relative Frequency:
Example: Relative Frequency Distribution of Student Test Scores
A teacher recorded the scores of 50 students and grouped them into class intervals.
| Class Interval (Marks) | Frequency (f) | Relative Frequency | Relative Frequency (%) |
|---|---|---|---|
| 0 – 10 | 5 | 5/50 = 0.10 | 10% |
| 10 – 20 | 8 | 8/50 = 0.16 | 16% |
| 20 – 30 | 12 | 12/50 = 0.24 | 24% |
| 30 – 40 | 10 | 10/50 = 0.20 | 20% |
| 40 – 50 | 15 | 15/50 = 0.30 | 30% |
| Total | 50 | 1.00 | 100% |
How to Interpret This Table?
-
The relative frequency column shows the proportion of each class relative to the total number of observations.
-
The percentage column converts it into a percentage format.
-
Example Interpretation:
-
24% of students scored between 20-30 marks.
-
30% of students scored between 40-50 marks, meaning this is the most common score range.
-
Uses of Relative Frequency Distributions:
✔ Probability Estimation – Helps estimate probabilities based on observed data.
✔ Data Comparison – Makes it easier to compare different datasets.
✔ Graphical Representation – Often visualized using histograms, bar charts, or pie charts.