1. Supply
Definition:
-
Supply refers to the quantity of a good or service that producers are willing and able to offer for sale at different prices over a given period of time.
- Assume you are a contact manufacturer of oreo biscuits. You manufacture and supply 1 Lakh Oreo biscuits to the company and the company then pays you ₹5 for every packet. The MRP on the packets is ₹20. As the company has recently announced they will be selling the biscuit packet for ₹15, you will be paid ₹4 now for every biscuit packet that you supply.
- Now, As a supplier, since your profit margin has decreased, would you like to produce more quanties than before as the price has decreased or would you like to manufacture some other biscuit where the profit margin is more and produce less of oreo biscuits as the price you are now receiving is less?
-
The law of supply states that, all else being equal, as the price of a good increases, the quantity supplied increases, and as the price decreases, the quantity supplied decreases. This is because producers are more willing to supply a good at a higher price, as they stand to make a greater profit.
2. Supply Curve
Definition:
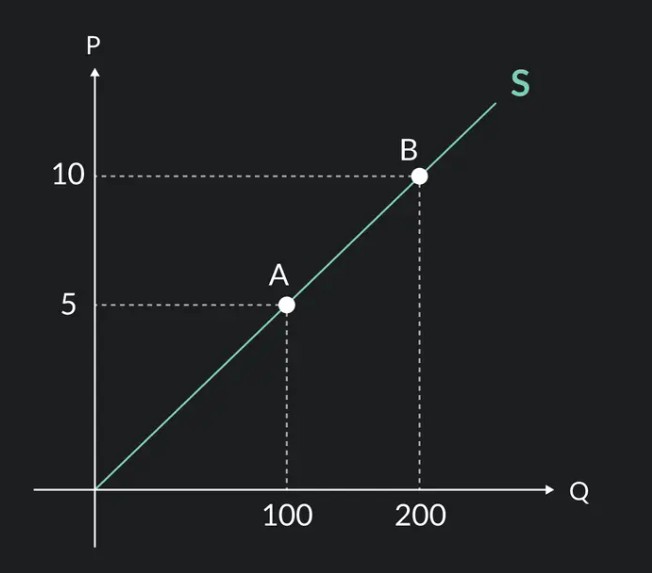
- A supply curve is a graphical representation of the relationship between the price of a good and the quantity supplied, typically showing a positive (direct) relationship.
Shape of the Supply Curve:
- The supply curve typically slopes upward from left to right. This upward slope reflects the law of supply: as the price of a good increases, the quantity supplied increases, as producers are incentivized to produce more at higher prices.
Graphical Representation:
- The vertical axis (Y-axis) represents the price.
- The horizontal axis (X-axis) represents the quantity supplied.
Shifts vs. Movement Along the Supply Curve:
- Movement along the curve: This occurs when there is a change in the price of the good, which leads to a change in the quantity supplied. For example, if the price of a good rises, there will be a movement up along the supply curve to a higher quantity supplied.
- Shift of the supply curve: A shift happens when there are changes in factors other than price (like technology or production costs), causing the entire curve to move to the left (decrease in supply) or to the right (increase in supply).
In Summary:
-
Decrease in input prices → Rightward shift in the supply curve → Increase in supply.
-
Increase in input prices → Leftward shift in the supply curve → Decrease in supply.