Break-Even Point (BEP) is the level of sales or output at which total revenue equals total costs, resulting in zero profit and zero loss. It is a critical financial metric used in cost-volume-profit (CVP) analysis to determine the minimum level of sales needed to cover all fixed and variable costs.
🔹 Definition:
Break-Even Point is the point at which Total Revenue = Total Cost, and the business makes no profit, no loss.
🔹 Formula:
There are two main formulas to calculate the BEP:
1. In Units:
2. In Sales Value:
| Option | Formula | Description |
|---|---|---|
| A | B.E.P. = Fixed Cost / P/V Ratio | Break-even sales in ₹ using contribution ratio |
| B | B.E.P. = Fixed Cost / [1 – (Variable Cost / Sales)] | Alternate form using sales and variable cost |
| D | B.E.P. = Fixed Cost / Contribution per Unit | Break-even point in units |
| E | B.E.P. = Actual Sales – Margin of Safety | Rearranged formula using margin of safety |
🔹 Key Concepts:
-
Fixed Costs: Costs that do not change with the level of production (e.g., rent, salaries).
-
Variable Costs: Costs that change in proportion to the output (e.g., raw materials).
-
Contribution per Unit: Selling Price – Variable Cost per unit.
-
P/V Ratio: Contribution / Sales × 100
🔹 Example:
Let’s assume:
-
Fixed Costs = ₹1,00,000
-
Selling Price per unit = ₹50
-
Variable Cost per unit = ₹30
-
Contribution per unit = ₹20
So, the company must sell 5,000 units to break even.
🔹 Graphical Representation:
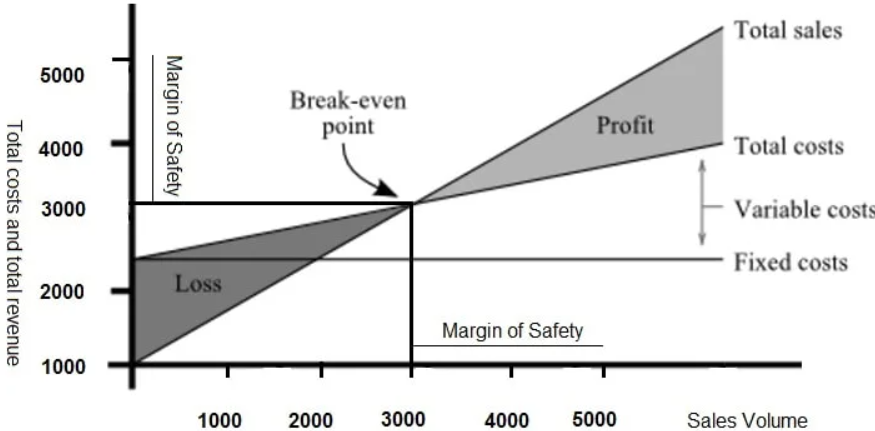
In a Break-Even Chart:
-
The X-axis represents the number of units or sales value.
-
The Y-axis represents revenue and costs.
-
The Break-Even Point is where the Total Cost Line intersects the Total Revenue Line.
🔹 Importance of Break-Even Analysis:
-
Profit Planning: Identifies the minimum performance needed to avoid losses.
-
Pricing Decisions: Helps determine the effect of pricing on profitability.
-
Cost Control: Aids in managing and reducing fixed and variable costs.
-
Investment Evaluation: Assesses the viability of launching a new product or entering a new market.
-
Margin of Safety Calculation: Tells how much sales can drop before incurring a loss.
🔹 Margin of Safety (MOS):
Once the break-even point is crossed, every additional sale contributes to profit. The margin of safety shows how much sales exceed the break-even point:
✅ Final Summary:
The Break-Even Point is a foundational financial metric that tells a business the exact volume of sales required to cover all costs and begin making profit. It plays a vital role in decision-making, risk analysis, and strategic planning.
Law of Diminishing Returns
✅ Definition
The Law of Diminishing Returns, also called the Law of Diminishing Marginal Returns, states that:
As additional units of a variable input (e.g., labor) are added to a fixed input (e.g., land or capital), the marginal product of the variable input will eventually decline, holding all other inputs constant.
In simpler terms, after a certain point, adding more of one input while keeping others fixed results in smaller and smaller increases in output.
✅ Assumptions
-
Only one input is variable (e.g., labor); all others are fixed (e.g., land, machinery).
-
Technology remains constant.
-
Input units are homogeneous (each additional unit is of the same quality).
-
It applies in the short run, where at least one factor is fixed.
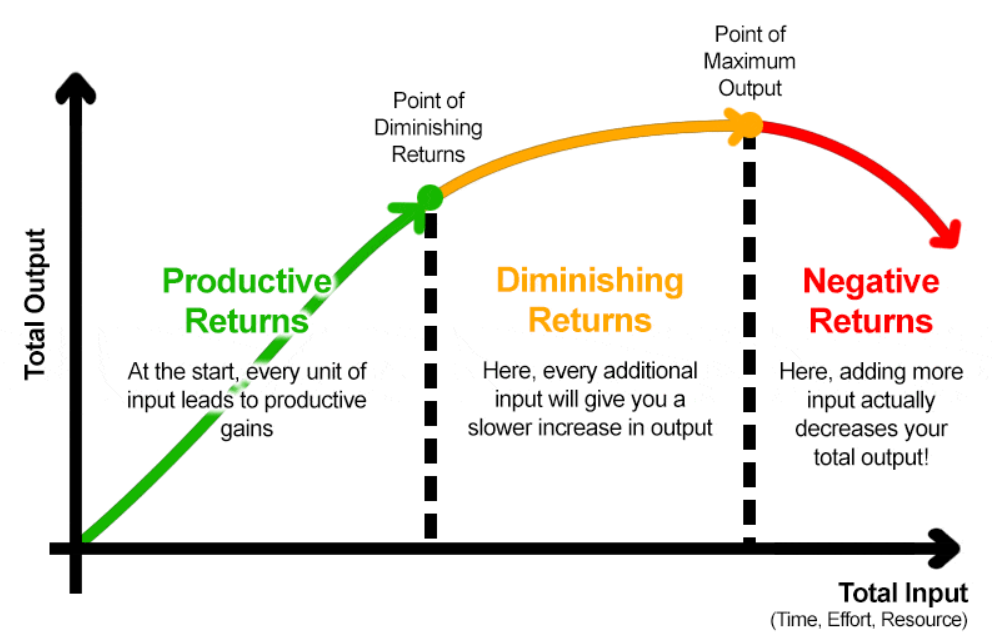
✅ Graphical Representation
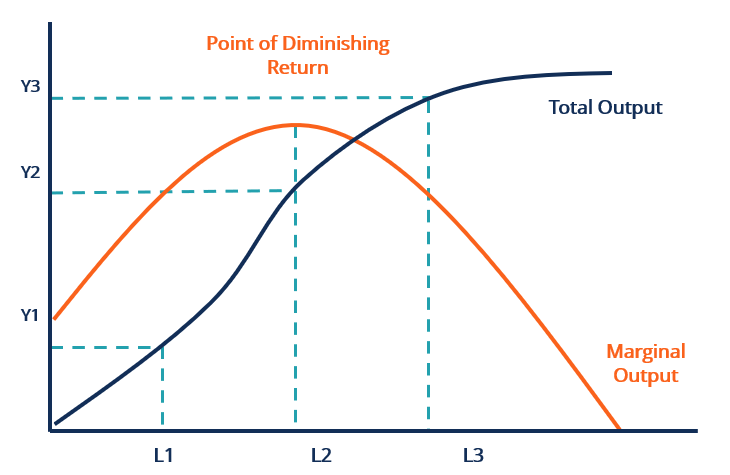
In a production graph:
-
The Total Product (TP) curve increases, but at a decreasing rate.
-
The Marginal Product (MP) curve rises initially, reaches a peak, then declines and may become negative.
✅ Conclusion
The Law of Diminishing Returns highlights an important constraint in production: when one input is increased while others are fixed, there comes a point when the productivity of the added input begins to fall. Recognizing this helps businesses allocate resources more efficiently and avoid wasteful input use.