📊 BCG Matrix
The BCG Matrix, also known as the Boston Consulting Group Growth-Share Matrix, is a strategic management tool used by businesses to analyze their portfolio of products or business units.
The BCG Matrix was developed by the Boston Consulting Group in the early 1970s. It is widely used for portfolio analysis and strategic planning.
It helps organizations decide how to allocate resources among their various units based on market growth and market share.
⚖️ Concept
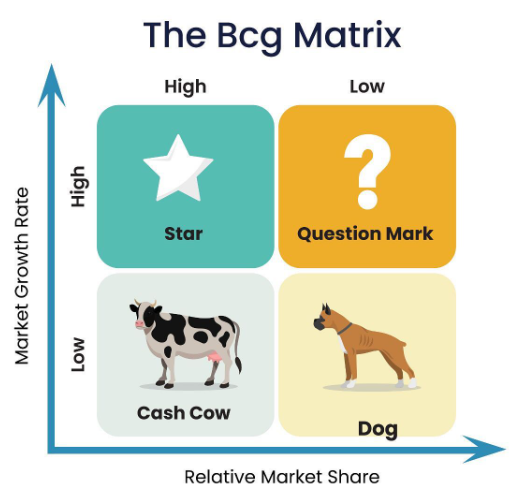
The matrix classifies business units or products into four categories based on two dimensions:
-
📈 Market Growth Rate (Vertical axis) – Measures the rate of growth of the market or industry. It indicates market attractiveness.
-
📊 Relative Market Share (Horizontal axis) – Measures the market share of the product/business relative to its largest competitor. It reflects competitive strength.
🟦 The Four Quadrants of the BCG Matrix
-
⭐ Stars
-
High market growth rate and high relative market share.
-
Stars are leaders in a rapidly growing market.
-
They often require significant investment to maintain their position and support further growth.
-
Over time, stars may become cash cows if market growth slows.
-
-
🐄 Cash Cows
-
Low market growth rate but high relative market share.
-
Cash cows generate steady and substantial cash flow due to their dominant position in a mature market.
-
They require relatively low investment and can fund other units.
-
-
❓ Question Marks (Problem Children)
-
High market growth rate but low relative market share.
-
Question marks operate in attractive markets but have weak competitive positions.
-
They consume a lot of cash and need strategic decisions to either invest heavily to gain market share or divest.
-
-
🐕 Dogs
-
Low market growth rate and low relative market share.
-
Dogs have weak positions in low-growth markets.
-
They typically generate low profits or losses and may be candidates for divestment or liquidation.
-
💡 Strategic Implications
-
⭐ Invest in Stars to capitalize on growth opportunities.
-
🐄 Milk Cash Cows to generate cash flow and fund other areas.
-
❓ Analyze Question Marks carefully — invest only if they can become stars.
-
🐕 Divest Dogs to minimize losses and reallocate resources.
| Quadrant | Description | Characteristics | Strategic Focus |
|---|---|---|---|
| ⭐ Stars | High market growth + High market share | Leaders in fast-growing markets, need investment | Invest to maintain growth; may become cash cows |
| 🐄 Cash Cows | Low market growth + High market share | Generate steady cash in mature markets | “Milk” for cash to fund other units |
| ❓ Question Marks | High market growth + Low market share | Operate in attractive markets but weak position | Decide to invest or divest |
| 🐕 Dogs | Low market growth + Low market share | Weak position in low-growth markets | Divest or liquidate |