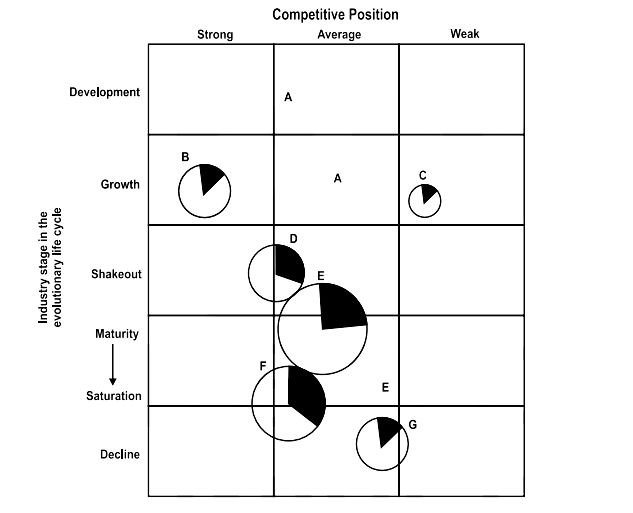
The Market Evolution Matrix by C.W. Hoffer and R. Schendel outlines how a Strategic Business Unit (SBU) evolves over time based on changes in product offerings and market characteristics. It focuses on the strategic positioning of businesses during industry and market evolution — unlike the Ansoff Matrix which focuses more on immediate growth options.
✅ Sequence in C.W. Hoffer’s Product-Market Evolution Matrix
🔢 1. Development
🔢 2. Growth
🔢 3. Shakeout
🔢 4. Maturity
🔢 5. Saturation
🔢 6. Decline
1️⃣ Development Stage
-
Product and market are both new.
-
High uncertainty, experimentation, and investment.
-
Strategy: Innovate and educate.
2️⃣ Growth Stage
-
Market acceptance is growing.
-
Sales rise rapidly, profitability improves.
-
Strategy: Gain market share, invest in production & marketing.
3️⃣ Shakeout Stage
-
Growth slows; competitive pressure rises sharply.
-
Weaker competitors are forced out.
-
Strategy: Efficiency, consolidation, differentiation.
4️⃣ Maturity Stage
-
Market becomes fully established, and growth levels off.
-
High competition, low innovation, and brand loyalty increase.
-
Strategy: Defend market share, enhance operational efficiency.
5️⃣ Saturation Stage
-
Market is overcrowded and stagnant.
-
Very limited or no growth, all potential buyers have been reached.
-
Price wars are common; demand becomes replacement-driven.
-
Strategy: Product bundling, repositioning, loyalty programs.
✅ Saturation comes after maturity because it represents the extreme end of the maturity stage, where the market is maxed out.
6️⃣ Decline Stage
-
Sales fall, often due to new technologies, changing tastes, or better substitutes.
-
Strategy: Exit, harvest, or reinvent.